Metric Widget V1 - deprecated
The Metric Widget presents a high-level interpretation based on metrics derived from data collected over an extended period. By aggregating multiple measurements, it offers users a broader understanding of their health trends and insights. Ideal for users interested in comprehensive health tracking, this widget can display aggregated values like stress levels or fitness scores. It’s designed to provide an overview that aids in interpreting long-term health progress.
Layout
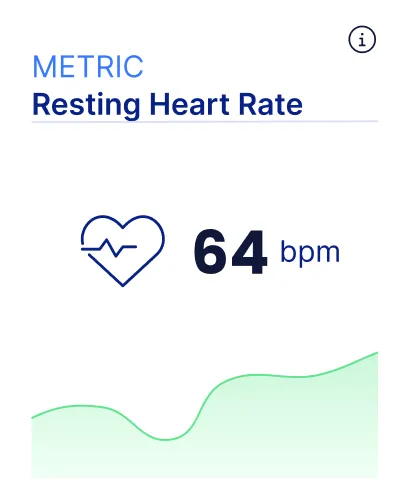
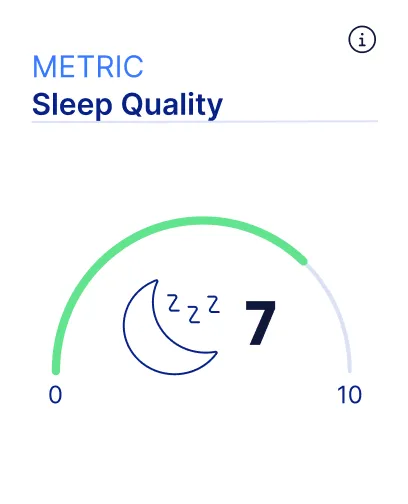
Section titled “Layout”Small
Medium
View the IntelliWidgets.js reference ->
Creating the widget
Section titled “Creating the widget”The code snippet below creates a Metric widget and mounts it to the DOM:
const intelli = IntelliProveWidgets("user_action_token");
const config = { /* config */ };const variation = "default";const themeOverrides = { /* theme overrides */ };intelli.mountWidget(    "#heart-rate-tile",    "metric",    config,    variation,    themeOverrides);
Config
Section titled “Config”The Metric widget requires additional configuration parameters that describes which parameter should be displayed.
const config = { parameter: "resting_heart_rate"}| Property | Description |
|---|---|
parameterstring | Metric of choice |
List of available metrics:
| Parameter | Layouts |
|---|---|
| resting_heart_rate | small |
| resting_respiratory_rate | small |
| mental_stress | small |
| mental_health_risk | small |
| sleep_quality | small |
| energy_balance | small |
| general_fitness_level | small |
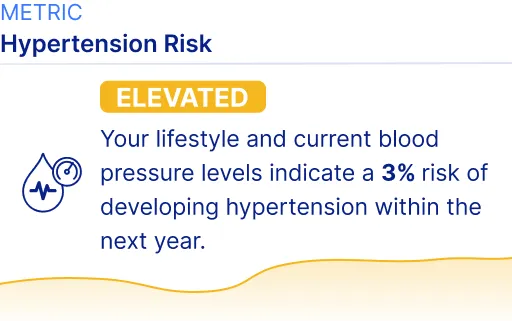
| hypertension_risk | medium |
Variation
Section titled “Variation”Two variations of the Metric widget are available:
- “default”
- “arc”
Theme Overrides
Section titled “Theme Overrides”The Metric Widget allows individual fine-tuning of the appearance.
The used accent colors are:
- Functional Primary 500
- Functional Secondary 500
- Functional Tertiary 500
JSON Data
Section titled “JSON Data”Retrieve the metric widget data in JSON format using the Rest API. The data field of the response body describes the widget properties.
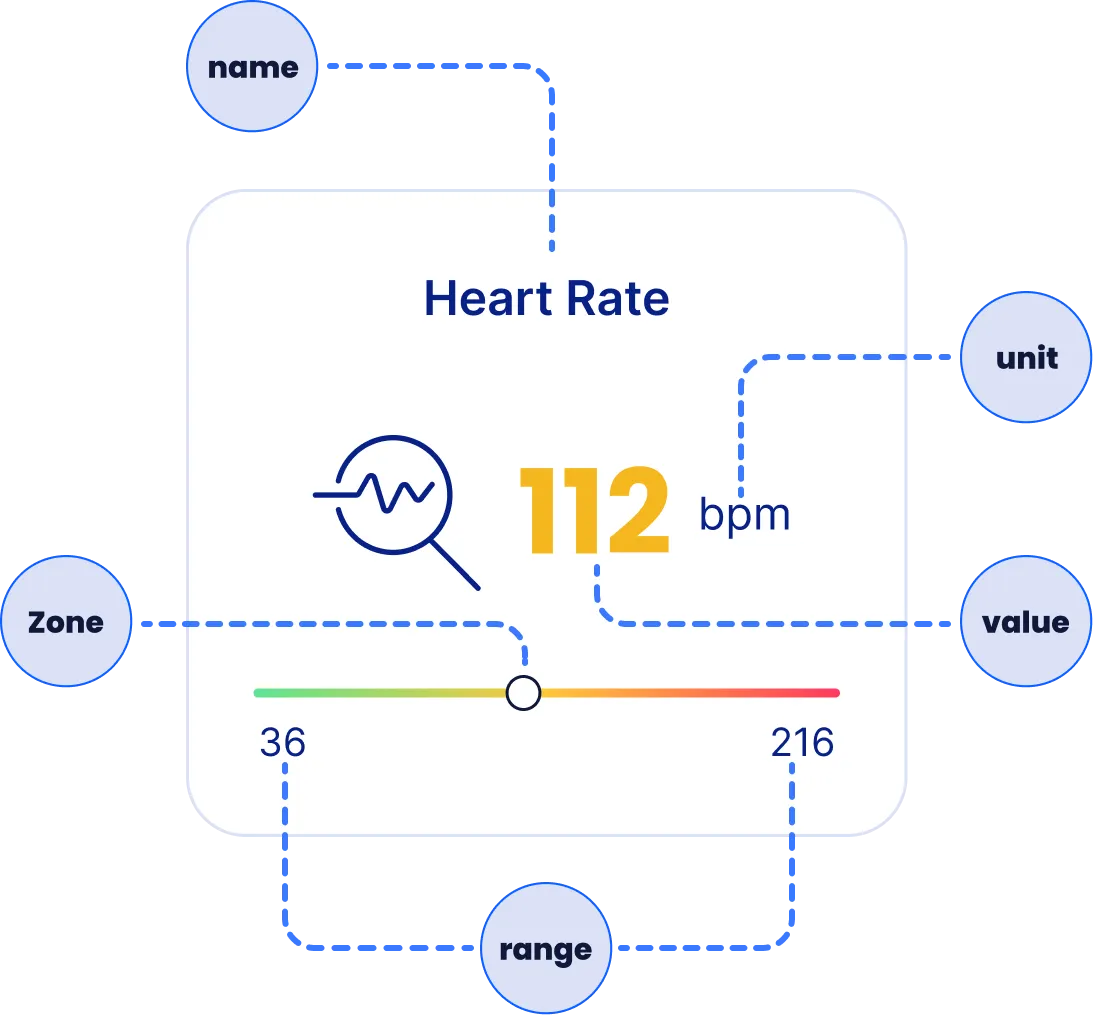
The metric widget consists of the following fields (similar to the biomarker widget):
- The
valueis the actual numerical value. It can be an integer or a floating point number. - The
unitholds a textual value for the unit of the parameter. - The
rangerepresents the entire span of possible values for that the parameter, indicated by minimum and a maximum. - The
zoneindicates where the actual value falls, among three categories related to the health condition:- “good” (
zone: 1) - “neutral” (
zone: 2) - “bad” (
zone: 3)
- “good” (
- The
optimumdefines how the range should be interpreted and visualized. There are three possible values for optimum: “low,” “high,” and “middle.”- For “low”: Lower values are categorized as “good” (green color), while higher values are categorized as “bad” (red color)
- For “high”: Higher values are categorized as “good” (green color), while lower values are categorized as “bad” (red color).
- For “middle”: The “good” zone (green color) is centered around the middle of the range. Values lower or higher than this midpoint are categorized as “bad” (red color).