Biomarker Widget V1 - deprecated
The Biomarker Widget displays an objective indicator of health captured during a Face Scan , such as heart rate or respiratory rate. This widget is essential for users who need immediate, real-time feedback on specific health parameters. It’s designed for quick, actionable insights, making it easy for users to assess their current state and understand individual biomarker values. Integrate it within your platform to give users a clear, snapshot view of a particular aspect of their health.
Layout
Section titled “Layout”Small
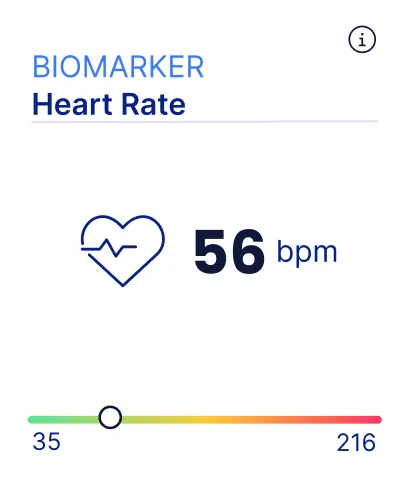
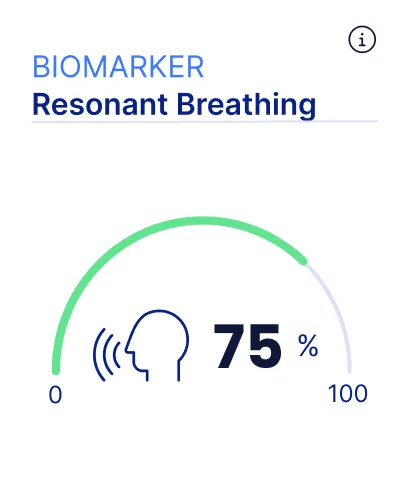
View the IntelliWidgets.js reference ->
Creating the widget
Section titled “Creating the widget”The code snippet below creates a Biomarker widget and mounts it to the DOM:
const intelli = IntelliProveWidgets("user_action_token");
const config = { /* config */ };const variation = "default";const themeOverrides = { /* theme overrides */ };intelli.mountWidget(    "#heart-rate-tile",    "biomarker",    config,    variation,    themeOverrides,    1 /* version */);
Config
Section titled “Config”The Biomarker widget requires additional configuration parameters that describe which kind of biomarker should be displayed and which Face Scan is referenced to display the value.
const config = { face_scan_id: "3db0ca35ba713354bfc2c2c215aba2a9" parameter: "heart_rate"}| Property | Description |
|---|---|
face_scan_idoptional string | Unique (internal) reference to a performed Face Scan. Set to null to display a placeholder widget. |
parameterstring | Biomarker of choice |
List of available biomarkers:
| Parameter | Layout |
|---|---|
| heart_rate | small |
| respiratory_rate | small |
| resonant_breathing_score | small |
| heart_rate_variability | small |
| blood_pressure | small |
Variation
Section titled “Variation”Two variations of the Biomarker widget are available:
- “default”
- “arc”
Theme Overrides
Section titled “Theme Overrides”The Biomarker widget allows individual fine-tuning of the appearance.
The used accent colors are:
- Functional Primary 500
- Functional Secondary 500
- Functional Tertiary 500
JSON Data
Section titled “JSON Data”Retrieve the biomarker widget data in JSON format using the Rest API. The data field of the response body describes the widget properties.
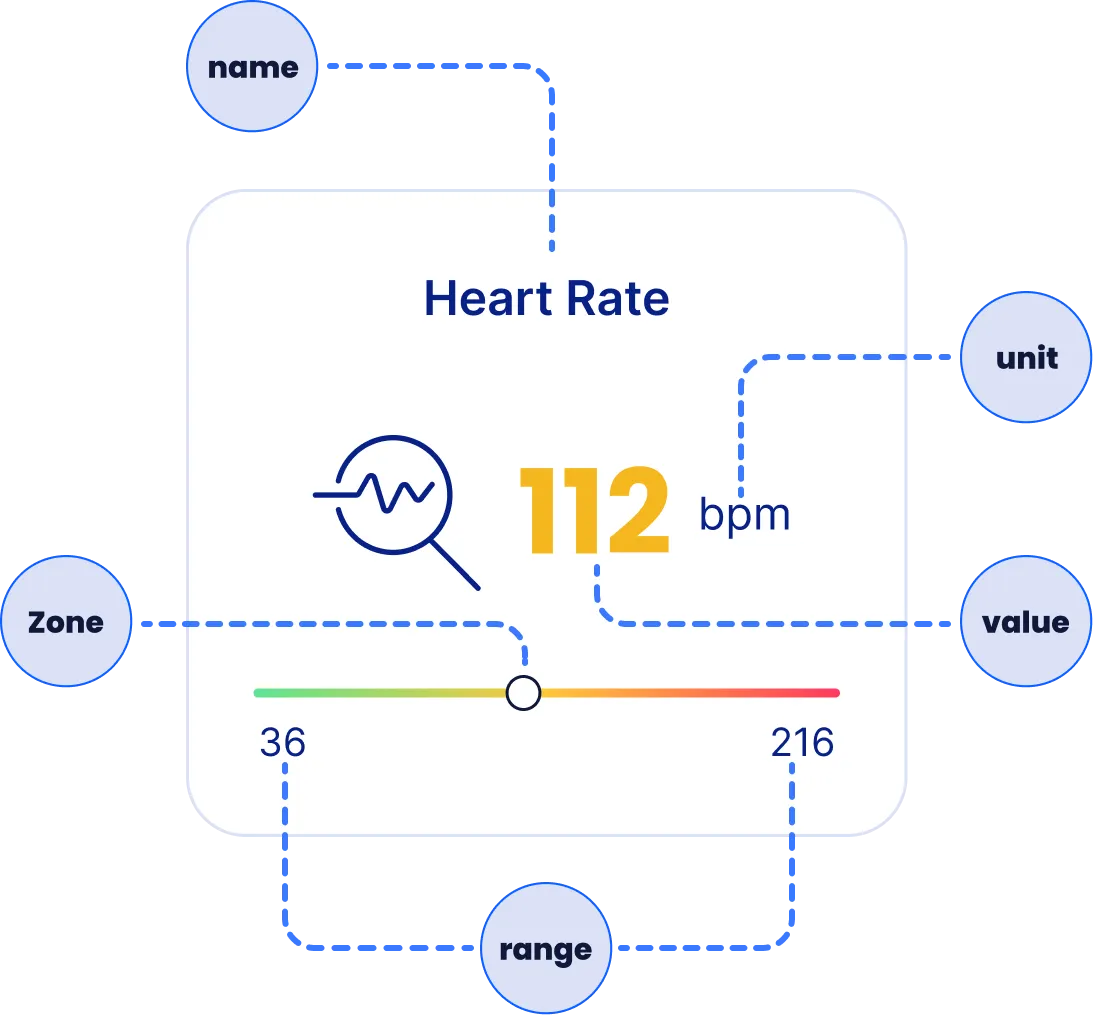
The biomarker widget consists of the following fields (similar to the metric widget):
- The
valueis the actual numerical value. It can be an integer or a floating point number. - The
unitholds a textual value for the unit of the parameter. - The
rangerepresents the entire span of possible values for that the parameter, indicated by minimum and a maximum. - The
zoneindicates where the actual value falls, among three categories related to the health condition:- “good” (
zone: 1) - “neutral” (
zone: 2) - “bad” (
zone: 3)
- “good” (
- The
optimumdefines how the range should be interpreted and visualized. There are three possible values for optimum: “low,” “high,” and “middle.”- For “low”: Lower values are categorized as “good” (green color), while higher values are categorized as “bad” (red color)
- For “high”: Higher values are categorized as “good” (green color), while lower values are categorized as “bad” (red color).
- For “middle”: The “good” zone (green color) is centered around the middle of the range. Values lower or higher than this midpoint are categorized as “bad” (red color).
- The
gradientStopsdefine the two color stops used to construct the linear gradient of the range bar. The values are expressed as offsets in the [0, 1] range, relative to the visual range of the bar.- The first stop marks the transition from green to yellow.
- The second stop marks the transition from yellow to red.
- When the gradient is flipped (e.g., indicating a reversed or descending direction), the first offset may be greater than the second. This allows for bidirectional coloring (e.g., green-to-red or red-to-green), depending on the context.