

Sleep Quality
The Sleep Quality metric provides insights into the overall quality and restorative nature of users’ sleep. It considers factors such as sleep duration and sleep-wake patterns to assess how well the user is recovering and preparing for the day ahead. By understanding sleep quality, users can make informed decisions to improve their rest and overall well-being. It allows users to quantify the quality of their sleep and corresponding ability to face greater challenges during the day.
Furthermore, Sleep Quality can be used to grow your active users by offering a daily powerful morning check-in within your platform.
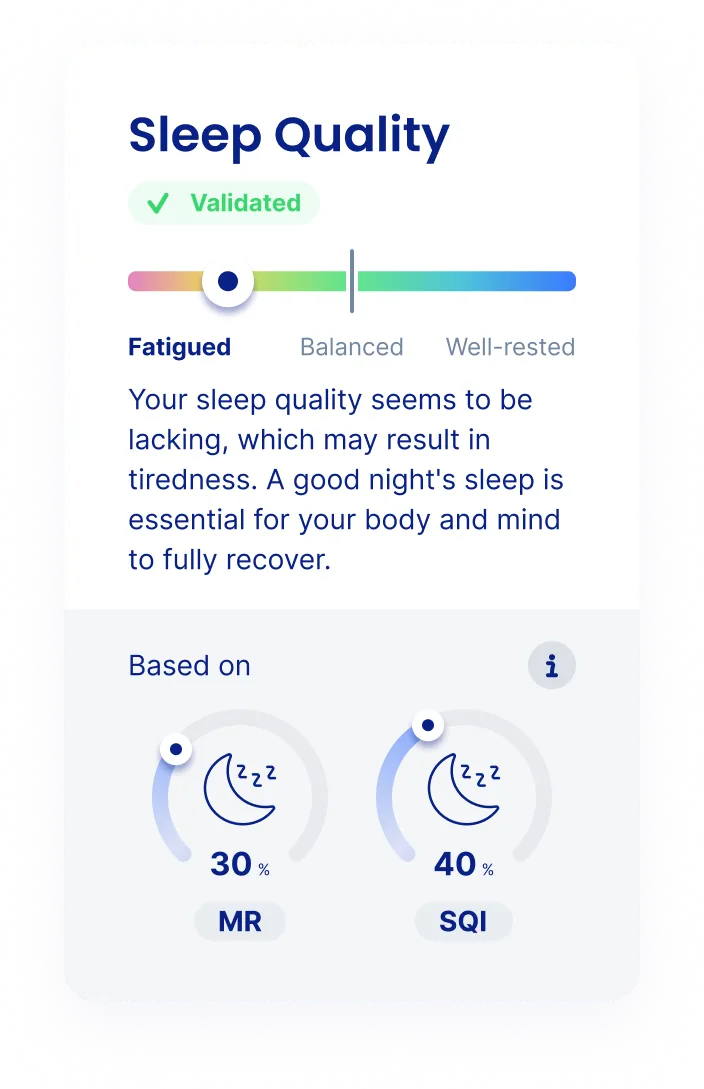
How is it calculated?
Section titled “How is it calculated?”The Sleep Quality metric is calculated using a combination of different data sources.
- Biometric data: heart rate (HR), heart rate variability (HRV), and stress levels.
- User-reported information: qualitative user input and contextual data about sleep habits.
- Facial keypoints: drooping/hanging eyelids, paler skin, redder eyes, more puffy/swollen eyes, dark circles under the eyes, more wrinkles/fine lines and more drooping corners of the mouth.
By integrating these data points, IntelliProve can provide a comprehensive assessment of sleep quality and deliver an accurate insight into the restorative effectiveness of the user’s sleep.
When is the first reading available?
The Sleep Quality is available after the first Face Scan. As more Face Scans are performed and questions answerred throughout the processes, the baseline gets established and confidence increases.
Accuracy
Section titled “Accuracy”To validate the accuracy of the Sleep Quality calculation through the IntelliProve algorithm, a benchmarking study was performed between ‘The Groningen Sleep Quality Score’ and the IntelliProve Sleep Quality metric. In 87% of the cases a poor night’s sleep, with negative impact on energy level, is correctly identified.
How can it be used?
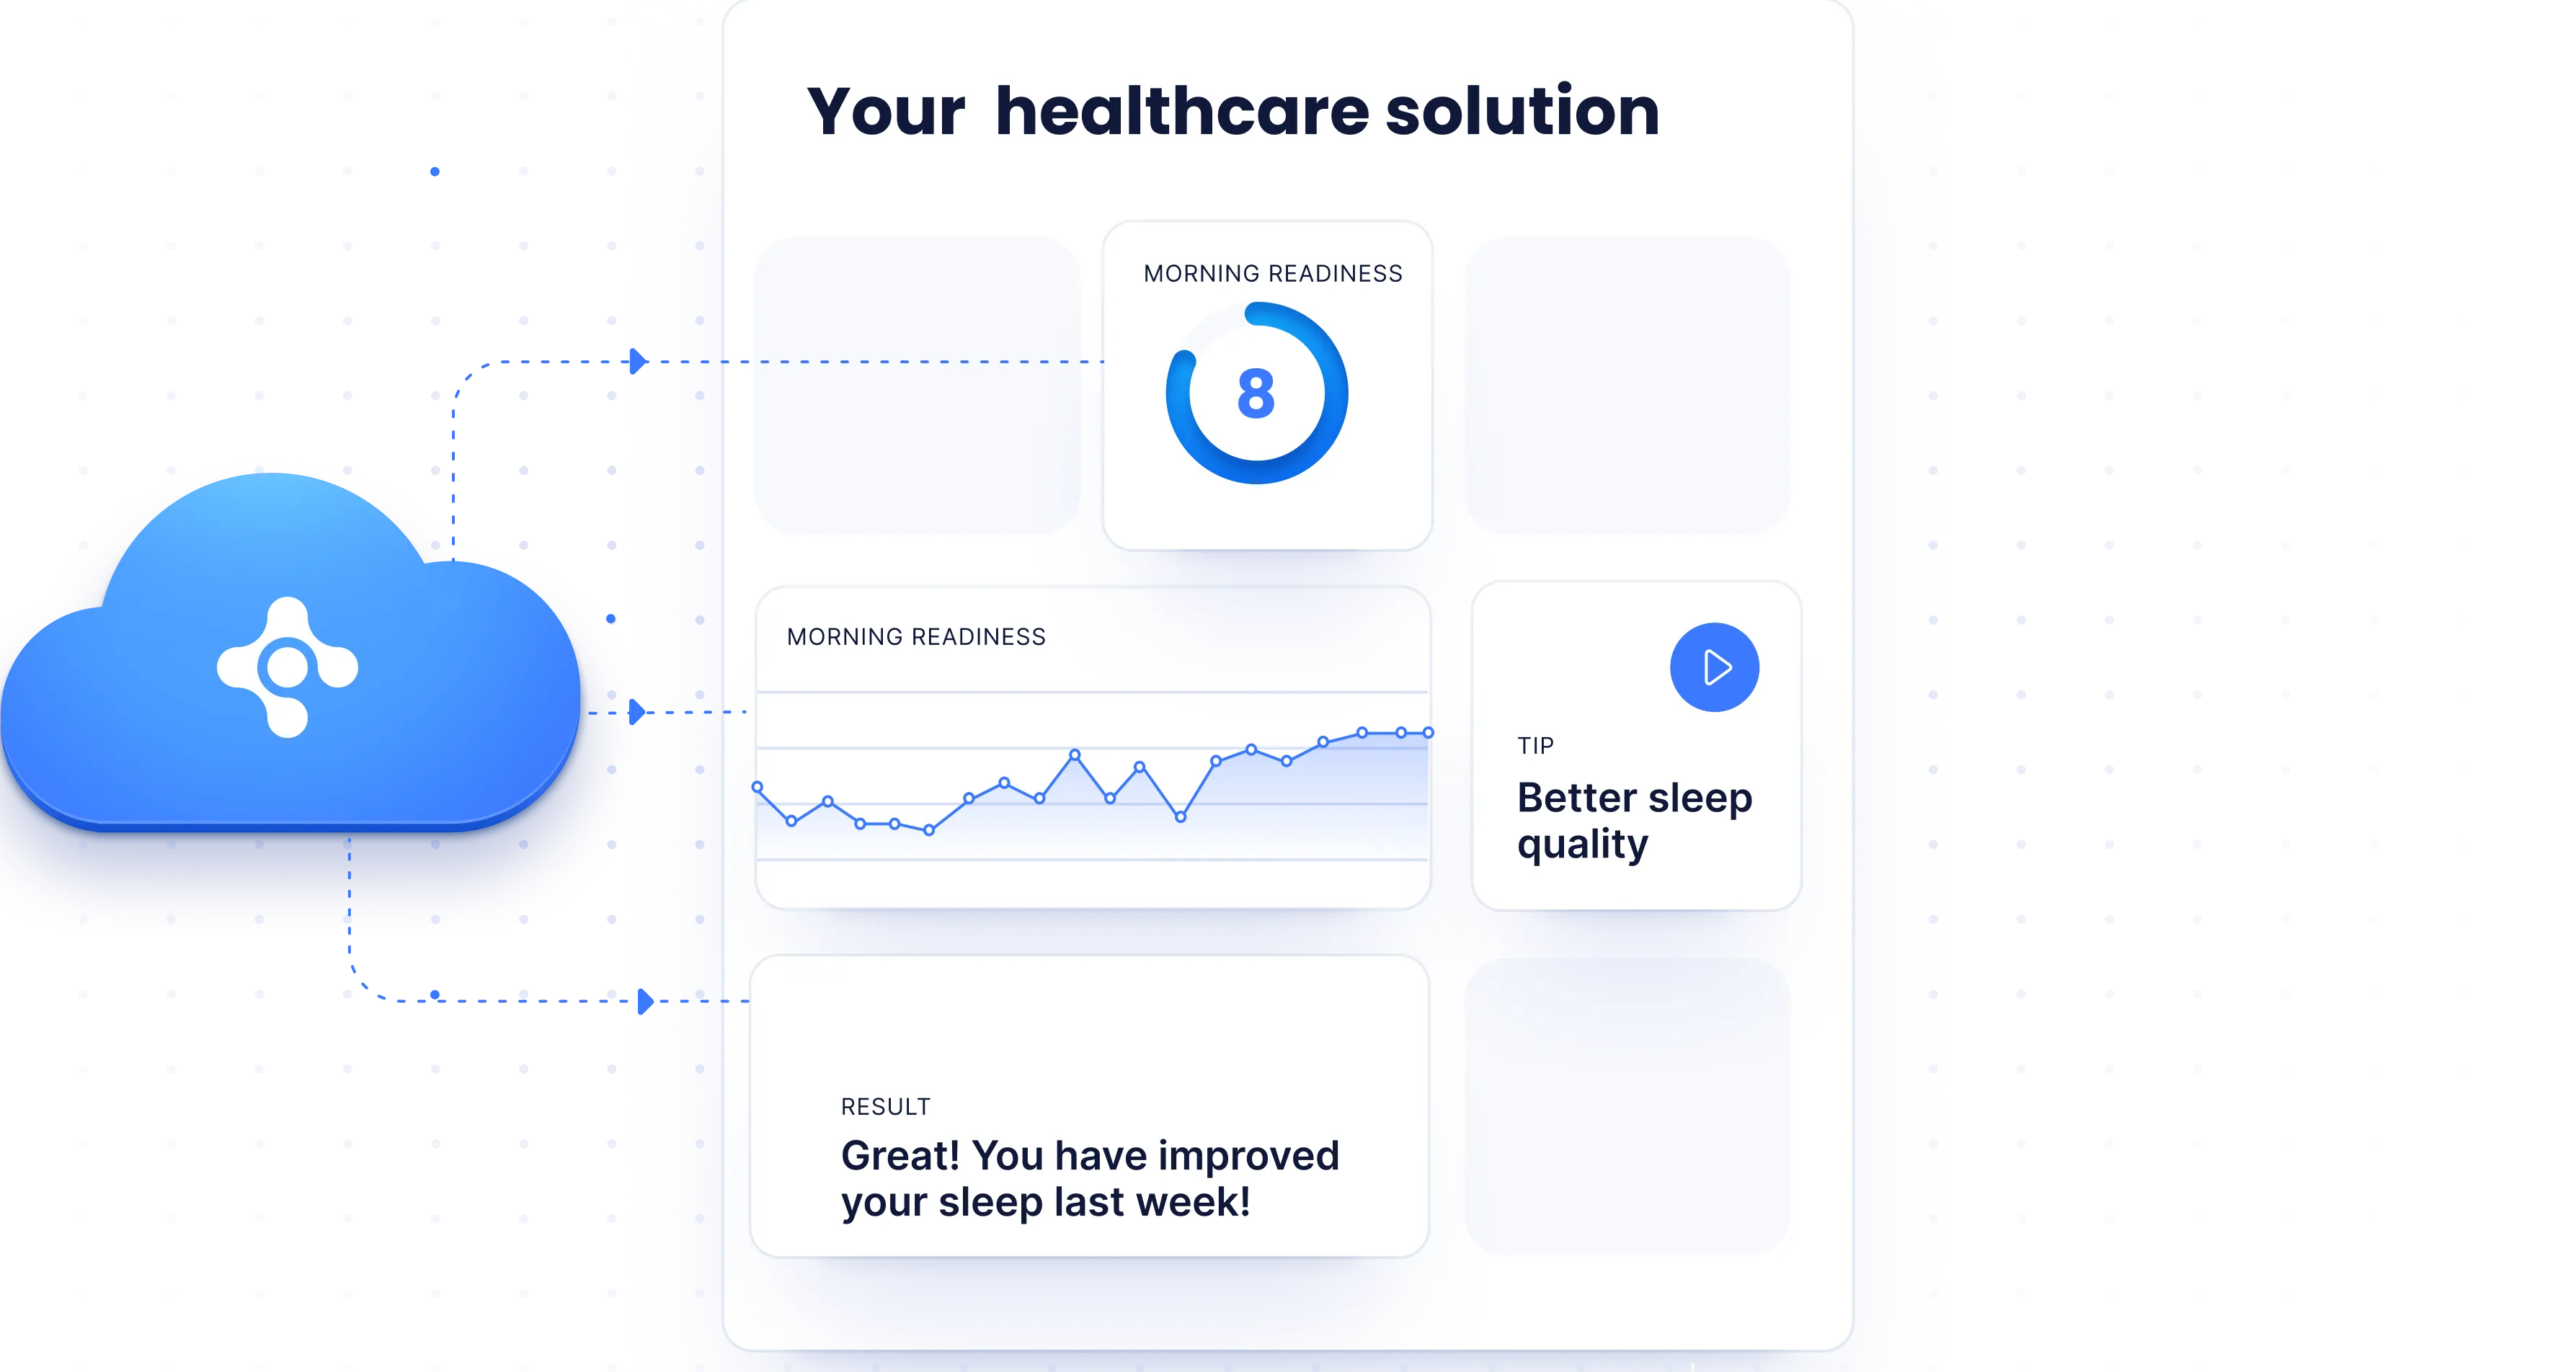
Section titled “How can it be used?”This metric helps users understand their sleep quality and emotional well-being each morning, guiding them on whether they are ready for peak performance or if they should prioritize rest and recovery.
Sleep Quality can also support users in improving their sleep patterns and optimizing sleep therapy. By tracking progress and analyzing the effectiveness of sleep interventions, users can refine both the duration and quality of their sleep routines. A lower Sleep Quality score can serve as a starting point to guide users toward sleep-enhancing content, like articles, videos, exercises, or therapy options.
Interpreting results
Section titled “Interpreting results”Sleep Quality is returned as an integer on a scale of 0 to 100 and can be requested as a Widget or via the Rest API.
Definitions
Section titled “Definitions”| Name | Unit | Range | programmatic name | Health Profile |
|---|---|---|---|---|
| Sleep Quality | Percentage [%] | 0 - 100 | sleep_quality | Energy & Sleep |
Values
Section titled “Values”Value | Meaning | Zone | Example User Text |
<20 | Low | Red | Stress or bad sleep could be sneaking up on you. Focus on hydration, rest and a good night’s sleep. |
20 – 39 | Low -Medium | Yellow | Your sleep quality scores are leaning towards fatigue. Try to bring them up with a good night’s rest. |
40 – 59 | Medium | Green | Your sleep quality score indicates that you have recovered quite well. Plan for some moderate physical exercises or mental activities, but don’t overdo it. |
60 – 79 | Medium - High | Cyan | You’re well-rested! Your biomarkers are showing great recovery and adaptability to stress. |
80 – 100 | High | Blue | You’re a sleep expert! You’ve fueled your body to sharpen focus, mood and resilience throughout the day. Well done! |
Scientific papers
Section titled “Scientific papers”- Sundelin T, Lekander M, Kecklund G, Van Someren EJ, Olsson A, Axelsson J. 2013. Cues of fatigue: effects of sleep deprivation on facial appearance. Sleep. 36(9):1355–1360.
- Van de Water AT, Holmes A, Hurley DA. 2011. Objective measurements of sleep for non-laboratory settings as alternatives to polysomnography—a systematic review. J Sleep Res. 20(1 Pt 2):183–200.
- Peng X, Luo J, Glenn C, Chi LK, Zhan J. 2018. Sleep-deprived fatigue pattern analysis using large-scale selfies from social media. arXiv preprint arXiv:1802.08310.