

Mental Health Risk
The Mental Health Risk metric offers a comprehensive, holistic approach to evaluating an individual’s potential risk of developing a mental health condition over time. Such conditions are characterised by significant disturbances in cognition, emotional regulation, or behaviour.
This metric is a clinically validated benchmark that aligns with standard assessments like the PHQ-9, GAD-7, and CSAI-2 questionnaires, focusing on physiological markers of stress and anxiety.
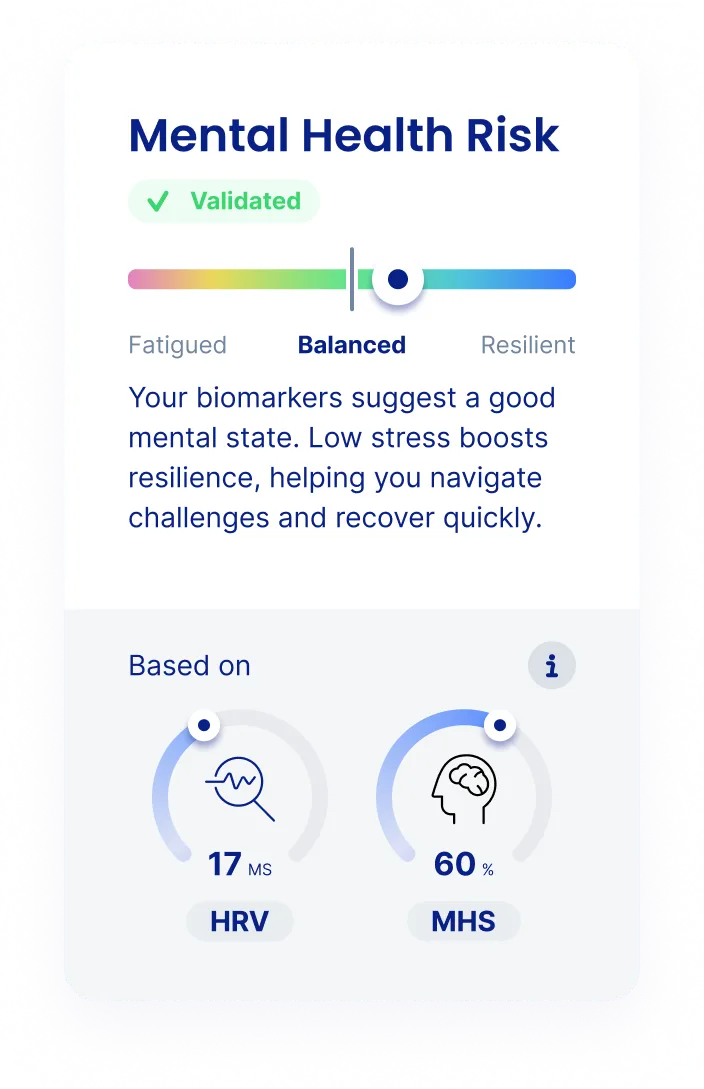
How is it calculated?
Section titled “How is it calculated?”IntelliProve’s processing engine uses machine learning informed by HRV metrics, subtle facial muscle movements, and context-based reasoning to assess Mental Health Risk. By comparing these factors over time, the metric provides a risk level of low, medium, or high relative to the user’s baseline.
When is the first reading available?
The Mental Health Risk is available after the first Face Scan. As more Face Scans are performed and questions answerred throughout the processes, the baseline gets established and confidence increases.
Example timeline with Face Scans:
- Week 1: Monday & Wednesday - No MHR available yet.
- Week 2: Tuesday & Friday - No MHR available yet.
- Week 3: Monday & Tuesday - First MHR score displayed on Wednesday
Accuracy
Section titled “Accuracy”Participants were asked to fill in a combination of questionnaires to assess the mental health status of the individual in terms of depression (PHQ-9) and anxiety (GAD-7). Based on the outcome of these questionnaires, every participant was classified according to a certain mental health risk profile (low, medium or high):
- Low: GAD-7<5 AND PHQ-9<5
- Medium: 5≤GAD-7≤9 AND/OR 5≤PHQ-9≤9
- High: GAD-7>9 AND/OR PHQ-9>9
It can be concluded that in 100% of the cases participants with a high mental health risk will also be labeled as ‘high risk’ through the IntelliProve processing engine (true positive cases). Although the discriminative power of IntelliProve between medium and low risk profiles is substantially lower, it can be concluded that 89.1% of the combined medium/low cases will also be labeled as medium/low through IntelliProve.
How can it be used?
Section titled “How can it be used?”The Mental Health Risk metric is particularly valuable in preventive care by identifying negative trends early. While one bad day doesn’t imply a high Mental Health Risk, a continuous series of negative days or a prolonged decline may signal potential issues, such as burnout.
By providing a risk score, IntelliProve raises awareness about potential concerns, helping users recognize early signs and encouraging timely intervention. In cases of high risk, users could be advised to consult with a mental health professional for further support. This objective biomarker complements subjective self-reporting, offering a fuller picture of the user’s mental health status.

Interpreting results
Section titled “Interpreting results”Mental Health Risk is returned as a value between 1 and 3 and can be requested as a Widget or via the Rest API.
Definitions
Section titled “Definitions”| Name | Unit | Range | programmatic name | Health Profile |
|---|---|---|---|---|
| Mental Health Risk | % – A score between 0 and 100 | 0 - 100 | mental_health_risk | Mental Health |
Values
Section titled “Values”| Value | Meaning | Zone | Example User Text |
|---|---|---|---|
| 67-100 | Minimal mental health risk | Green | You have a minimal risk of mental health conditions. Great! |
| 34-66 | Average mental health risk | Green-Yellow | You have a low risk of mental health conditions. Keep prioritizing your well-being and take mental breaks when needed. |
| 0-33 | Increased mental health risk | Red | You have a higher-than-normal risk of mental health conditions. Consider reaching out to a physician or mental health provider if your mental strain persists. |
Scientific papers
Section titled “Scientific papers”- Kemp AH, Quintana DS, Gray MA, Felmingham KL, Brown K, Gatt JM. 2010. Impact of depression and antidepressant treatment on heart rate variability: a review and meta-analysis. Biol Psychiatry. 67(11):1067–1074.
- Wang X, Wang Y, Zhou M, Li B, Liu X, Zhu T. Identifying Psychological Symptoms Based on Facial Movements. Front Psychiatry. 2020 Dec 15;11:607890.
- Sharma, D., Singh, J., Sehra, S. S., & Sehra, S. K. (2024). Demystifying Mental Health by Decoding Facial Action Unit Sequences. Big Data and Cognitive Computing, 8(7), 78.
- Licht CM, de Geus EJ, Zitman FG, Hoogendijk WJ, van Dyck R, Penninx BW. 2008. Association between major depressive disorder and heart rate variability in the Netherlands Study of Depression and Anxiety (NESDA). Arch Gen Psychiatry. 65(12):1358–1367.
- Thayer JF, Åhs F, Fredrikson M, Sollers JJ 3rd, Wager TD. 2012. A meta-analysis of heart rate variability and neuroimaging studies: implications for heart rate variability as a marker of stress and health. Neurosci Biobehav Rev. 36(2):747–756.